At MPS, we are happy to help you become more sustainable. Among other things, our MPS-ABC qualification overviews contribute to this, as they give you insight into your usage. As Service & Support sometimes receives questions about these overviews, we will highlight one part of the MPS-ABC qualification overviews per month in the coming period and provide an explanation. You can find your qualification overviews in the Customer Portal, where you can download them at the top right.

The following sections will be explained per month:
- Table 1: Data qualifications
- Graph 1-5: Operating usage last year
- Graph 6-9: Operating usage by period
- Composition of points parental material and environmental zones
- Company usage MPS-MIND and MPS-OEX
By facilitating the keeping of your usage records on the environmental themes of crop protection agents, fertilisers, energy, waste and water in the MPS-ABC record-keeping environment, you gain insights into your relative environmental performance compared with growers of similar products under similar production circumstances.
In the qualification and period graphs you will see both qualification data expressed in points as well as usage expressed in kilograms and GJ. Your usage is assigned qualification points: the less you use, the more qualification points you get. This then leads to an MPS A+, A, B or C qualification. In addition, you gain an insight into your usage levels in the form of tables and graphs. Not only does this make your environmental performance transparent, but MPS-ABC also becomes a management tool that helps you to become more sustainable.
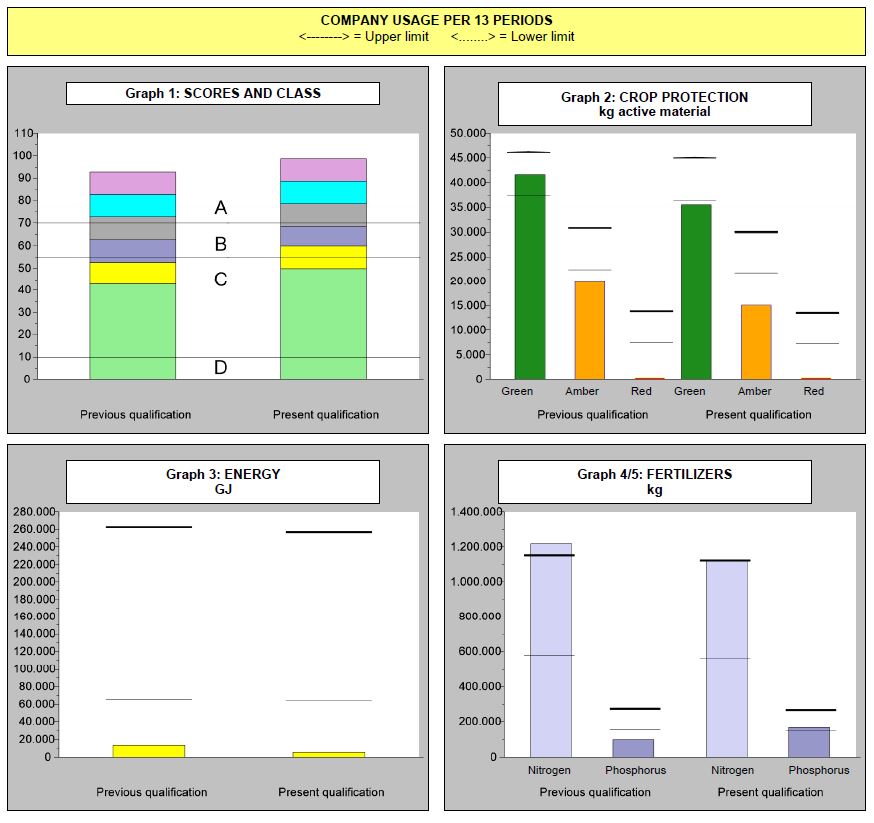
Graphs 1-5 show your qualification and usage data from your current and previous qualification. Here you can see whether you have made progress compared with your previous qualification. A qualification shows your operating usage and your qualification from the past 13 periods.
Graph 1: points and class
Graph 1 contains a breakdown of your qualification points for your current and previous qualification. The lines and the letters A, B, C and D indicate how many points you must obtain in order to receive the qualification at this level. Level A+ is the highest possible qualification and D is the lowest. The colours correspond to the subjects in table 1, qualification data: crop protection, energy, fertilisers, waste, water and certified starting material.
Graph 2: crop protection, kg active substance
In graph 2 you can see the total quantity of green, amber and red crop protection agents used compared with the lower and upper limits of the current and previous qualifications. The lower and upper limits are determined by the average of the bottom 20% of all MPS-ABC records with low usage and the average of the top 20% of all MPS-ABC records with high usage, respectively, measured in the same environmental cluster as yours. This allows you to see how you are performing in your environmental cluster. If your usage is below the lower limit for all crop protection colours, you will be eligible for an A+ qualification. If your usage exceeds the upper limit, you will receive no points for this part. Under “MPS-MIND usage composition” you can see the breakdown of your green, amber and red products.
Graph 3: Energy GJ
In graph 3 you can see your energy usage in GJ for your current and previous qualifications. This also shows you how you score compared with growers in the same environmental cluster. You can see the breakdown of your energy usage in graphs 7a and 7b.
Graphs 4/5: kg fertilisers
In graphs 4 and 5 you can see your usage of nitrogen and phosphorus fertilisers in kilograms in your current and previous qualifications. This also shows you how you score compared with growers in the same environmental cluster. In graphs 8 and 9 you can see the breakdown of nitrogen and phosphorus.

If you have questions about the overviews or as a result of this message, please contact Service & Support via +31 (0) 174 – 615 715 or via info@my-mps.com.


