At MPS, we are happy to help you become more sustainable. Among other things, our MPS-ABC qualification overviews contribute to this, as they give you insight into your usage. As Service & Support sometimes receives questions about these overviews, we will highlight one part of the MPS-ABC qualification overviews per month in the coming period and provide an explanation. You can find your qualification overviews in the Customer Portal, where you can download them at the top right.

The following sections will be explained per month:
- Table 1: Data qualifications
- Graph 1-5: Operating usage last year
- Graph 6-9: Operating usage by period
- Composition of points parental material and environmental zones
- Company usage MPS-MIND and MPS-OEX
By facilitating the keeping of your usage records on the environmental themes of crop protection agents, fertilisers, energy, waste and water in the MPS-ABC record-keeping environment, you gain insights into your relative environmental performance compared with growers of similar products under similar production circumstances.
In the qualification and period graphs you will see both qualification data expressed in points as well as usage expressed in kilograms and GJ. Your usage is assigned qualification points: the less you use, the more qualification points you get. This then leads to an MPS A+, A, B or C qualification. In addition, you gain an insight into your usage levels in the form of tables and graphs. Not only does this make your environmental performance transparent, but MPS-ABC also becomes a management tool that helps you to become more sustainable.
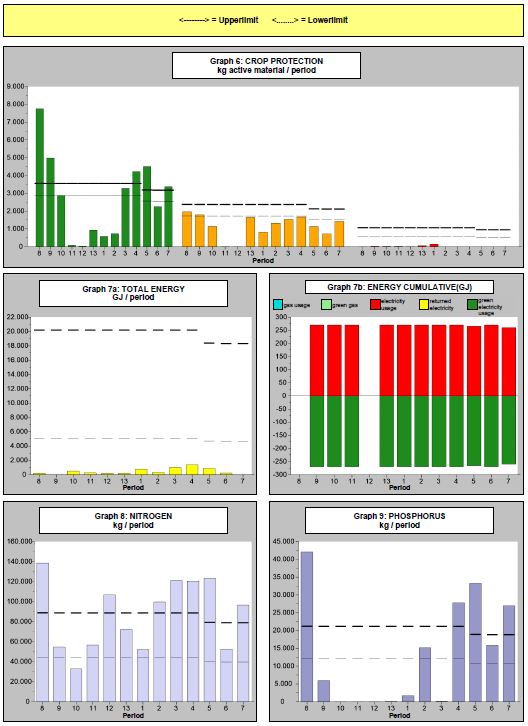
Graphs 6-9 display your usage data for the qualification by period.
Graph 6: crop protection, kg active substances/period
This graph illustrates the green, amber and red active substances used per period, relative to the lower and upper limits. You may have used less or more crop protection in certain seasons, and this can be linked to specific crops or pests. The lower and upper limits specific to your company may vary between periods, depending on the recorded surface areas for each crop, per period.
Graph 7a: total energy, GJ/period
This graph depicts your total energy usage per period. It takes into account both your usage and the energy fed back into the grid. You can see how you score each period with respect to the lower and upper limits. The lower and upper limits for energy usage specific to your company may vary between periods, depending on the recorded surface areas for each crop, per period.
Graphic 7b: cumulative energy (GJ)
This graph shows the composition of the total energy graph, expressed in GJ, per period. The components included in the energy composition are as follows:
- Gas usage
- Green gas usage
- Electricity usage
- Electricity fed back into the grid
- Green electricity usage
You can see the composition of your energy usedd and fed back into the grid for each period. If you feed back more energy than you use, this is displayed as negative usage in Graph 7a.
Graph 8: nitrogen, kg/period
This graph illustrates your total nitrogen usage in kilos per period. You can also see how you score each period with respect to the lower and upper limits. The value specific to your company may vary depending on the recorded surface areas for each crop, per period. This is visible in the fluctuating lower and upper limits.
Graph 9: phosphorus, kg/period
This graph depicts your total phosphorus usage in kilos per period. You can also see how you score each period with respect to the lower and upper limits. The value specific to your company will also shift per period here.
You can link your nitrogen and phosphorus usage to your fertiliser use in a specific period.
If you have questions about the overviews or as a result of this message, please contact Service & Support via +31 (0) 174 – 615 715 or via info@my-mps.com.